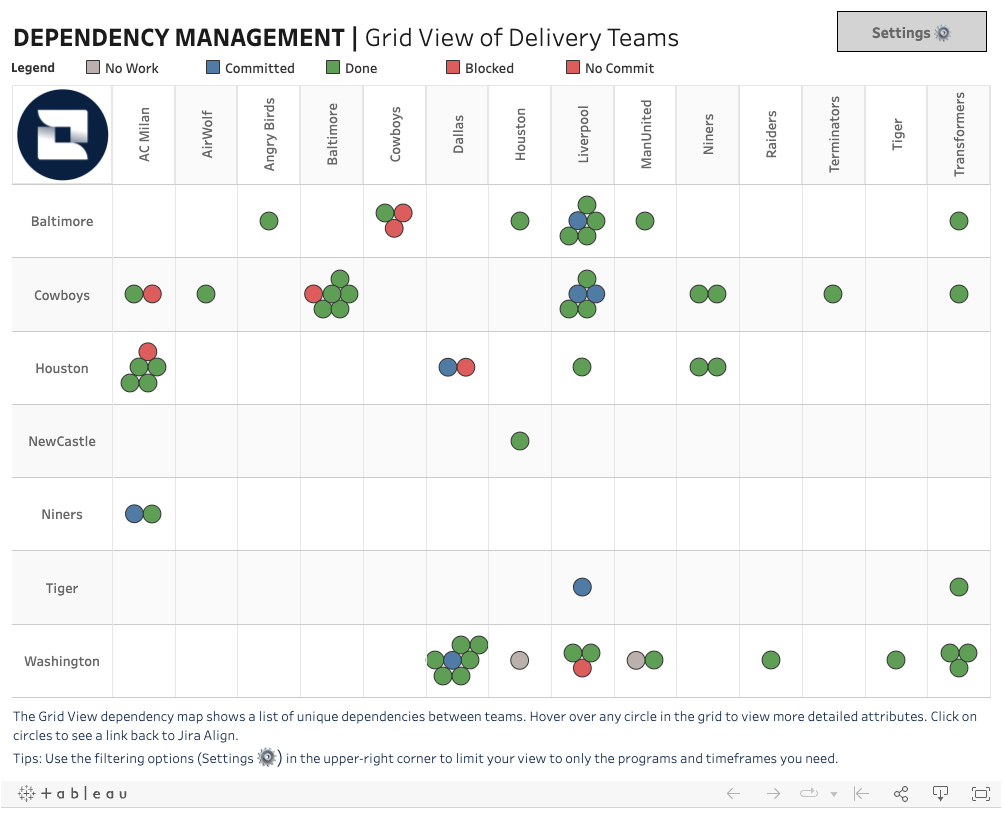
In Atlassian Jira Align, there are few ways the user can visualize dependencies. For the above visualization, I combined two dependency “maps” that are provided in the product. The first map shows every dependent and depended on team as slices of a wheal. Colored connections then show status of inbound or outbound dependencies between the teams. The second map show a matrix of cells, displaying the number of dependencies between dependent and depended on teams. I decided to combine the two.
Available to download the template from Tableau Public
Regardless of the organization or institution, there will always be dependencies. The larger the organization, the greater chance of the existence of dependencies.
Referring to dependencies,
Troy Magennis of www.focusedobjective.com asked the question about what are the chances of being on-time. He then stated, for every step of building something (dependencies), that step can be ontime or delayed. If we want to know the chances of each dependency being ontime, it will be 1 chance in 2^n (where n = number of dependencies).
To calculate the on-time chance, imagine the number of dependencies you have in your environment. Every dependency you remove DOUBLES your chances of success of n-time delivery.
1 Dependency = 1 in 2 change (50%)
2 Dependencies = 1 in 4 chance (25%)
3 Dependencies = 1 in 8 chance (12.5%)
4 dependencies = 1 in 16 chance (6.25%)
5 dependencies = 1 in 32 chance (3.125%)
The more dependencies you have, the worse your odds are of delivering on time.