
I keep getting asked, does Jira Align support Flow Metrics, as defined in the Flow Framework and SAFe? The short answer is yes. If you believe these metrics will help unlock the potential of your teams, use this community post to see working examples of Tableau reports I have created using Jira Align and Enterprise Insights.
Flow Metrics
The Flow Framework provides five metrics that can be used to measure different aspects of flow. As SAFe is a flow-based system, each of these metrics is directly applicable. In addition, SAFe defines Flow Predictability to measure how Teams, ARTs, and Solution Trains are delivering against their planned objectives.
Flow Velocity - Number of items completed in a given time
Flow Time - Time elapsed from when an item enters the workflow until it is release
Flow Efficiency - The portion of backlog items actively being work on, relative to total time elapsed
Flow Load - Total backlog work in process (across the entire workflow)
Flow Distribution - The proportion of backlog item types in the flow
Flow Predictability - Overall planned vs actual business value delivered in a given time
In the Tableau report examples below, I used common elements when applicable. The main area of each report is displaying moment in time information, usually defined by a PI or quarter and grouped by value stream. If in Tableau or viewing these reports within Jira Align, if you clicked on an element (square or circle) you’d have the option to navigate back to Jira Align to view all of the details relative to the work item. In the upper right of the detailed reports, you’ll see the moment in time information displayed as an average or aggregation. Last, if appropriate, I’ve added a historical trend. This allows the viewer to know where they have been and the direction they are headed.
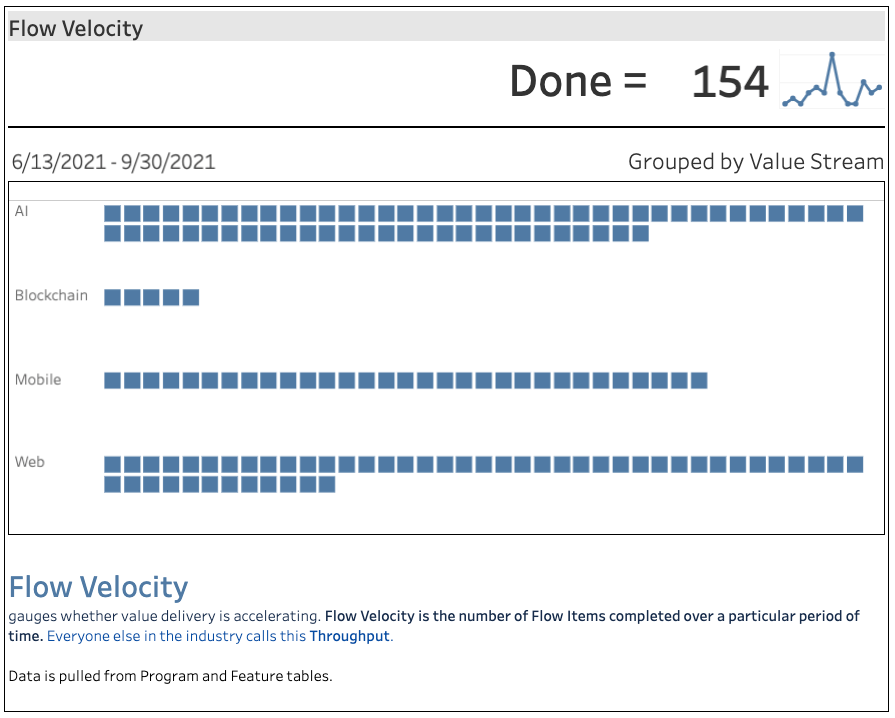
Flow Velocity
gauges whether value delivery is accelerating. Flow Velocity is the number of Flow Items completed over a particular period of time. Everyone else in the industry calls this Throughput. Each square on the report denotes a feature (flow item) completed within the timeframe. Selecting a square will provide a link back to Jira Align, where the user can view all of the details.
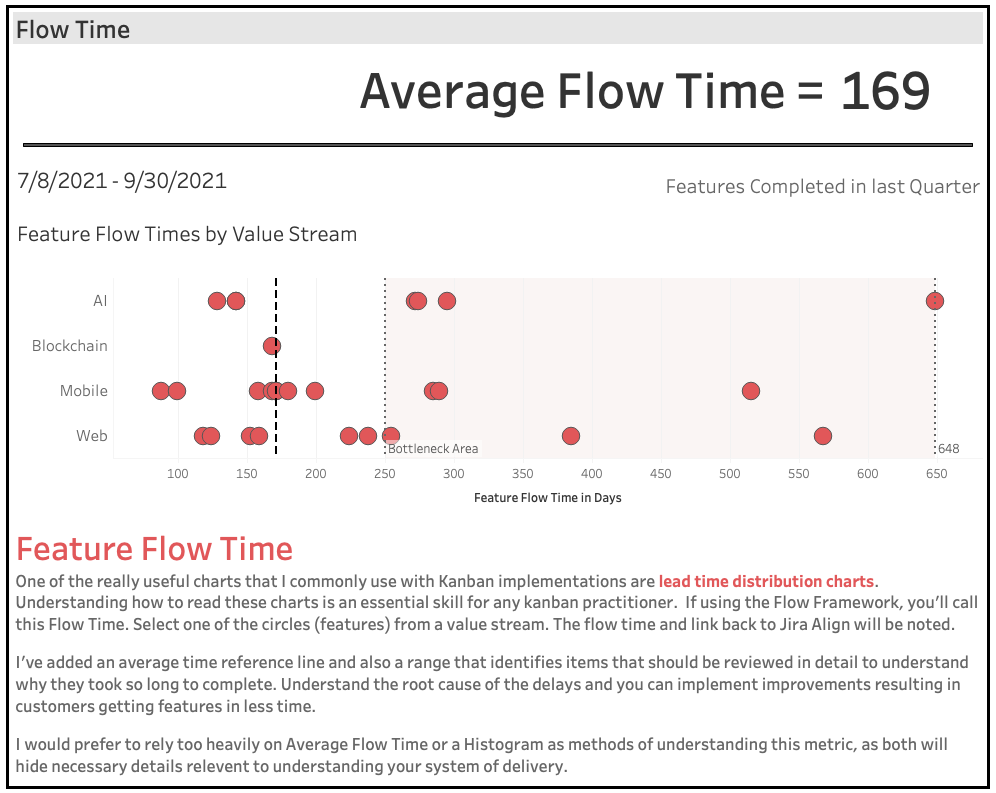
Flow Time
measures time to market. Flow Time measures the time elapsed from ‘work start’ to ‘work complete’ on a given Flow Item, including both active and wait times. Everyone else in the industry calls this Lead Time or Time to Market. Each circle on the report denotes a feature (flow item) in a value stream. Selecting a circle will provide a link back to Jira Align, where the user can view all of the details.
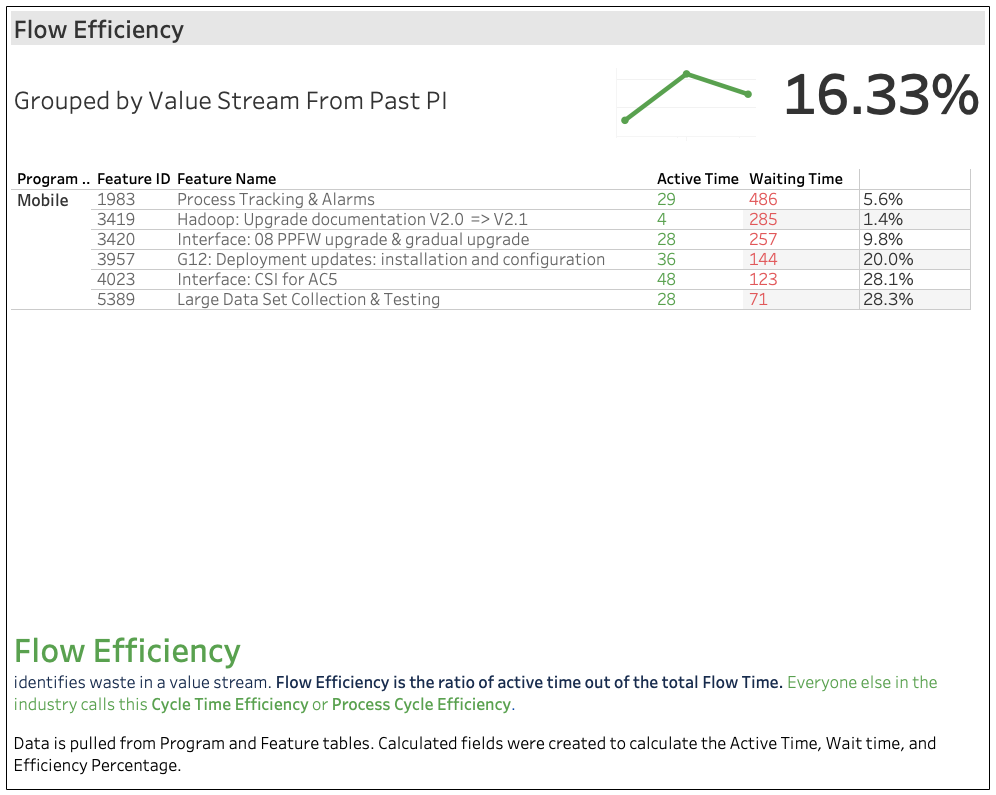
Flow Efficiency
identifies waste in a value stream. Flow Efficiency is the ratio of active time out of the total Flow Time. In the example, each row is a feature completed in the last PI. The green numbers are the number of days in active states. Red numbers denote days in inactive states. Everyone else in the industry calls this Process Cycle Efficiency or Cycle Time Efficiency.
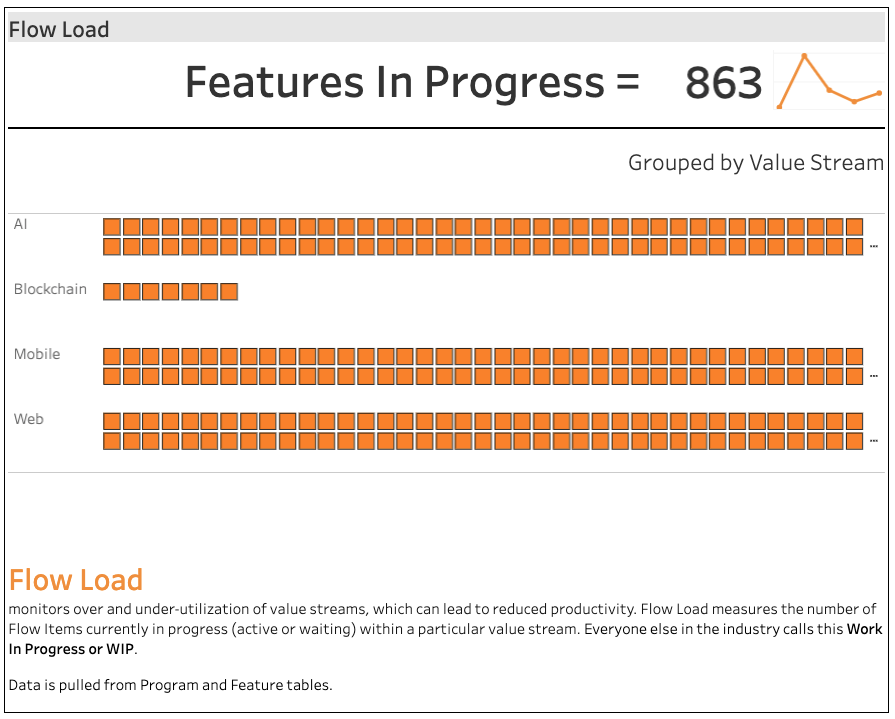
Flow Load
monitors over and under-utilization of value streams, which can lead to reduced productivity. Flow Load measures the number of Flow Items currently in progress (active or waiting) within a particular value stream. Each square on the report denotes a feature (flow item) in a value stream. Selecting a square will provide a link back to Jira Align, where the user can view all of the details. Everyone else in the industry calls this Work in Progress (or Process) or WIP.
Flow Distribution
illustrates the tradeoffs between Flow Items in a reporting period. Flow Distribution measures the distribution of four Flow Items — Features, Defects, Risks and Dependencies — in your value stream’s delivery. (if you have other item types that take up delivery capacity, include them)

Flow Predictability
illustrates how well teams, ARTs and Solution Trains are able to plan and meet their PI objectives. How is it measured? It's the ratio of planned and actual items over time. Low or erratic predictability makes delivery commitments unrealistic and often highlights underlying problems in technology, planning, or organization performance that need addressing. Reliable trains should operate in the 80 – 100 percent range; this allows the business and its stakeholders to plan effectively.

Conclusion
Ask any Kanban practitioner, and they would say there isn’t anything new about these metrics. They’ve been around for years. But now that they’ve been repackaged and referenced in SAFe, there is newfound interest. If you have a customer who is interested in Flow Metrics or wants to use Jira Align, Enterprise Insights, and Tableau to create them, I’m excited to talk with them.