What is a Fever Chart
A fever chart displays data with a graphical transition from a safe zone to an unsafe zone. Green is assumed favorable and red is assumed unfavorable. At a minimum, a red zone will simulate a (fever) temperature reaching an unfavorable level.
What is a Buffer Chart
A buffer chart displays the consumption of buffer time relative to an estimated time commitment. What is buffer? If your boss asks you how long it will take you to complete something, you will likely add a “buffer” or pad the estimate, to increase the chance you’ll complete the work relative to your estimate. If you think something will take you four hours and you add a 25% buffer (one additional hour), your total estimate will be five hours.
Why add a buffer
Let’s say you get asked how long something is going to take or you’re given a deadline to deliver a product or service. If the request is something you’ve done before, you may add very little or no buffer to your estimate. You have a higher confidence of how long it will take. If the request is something you’ve never done before or if you are dependent on someone or something beyond your control, you’ll likely pad your estimate. The greater the uncertainty and risk, the greater the padding.
How to visualize the buffer
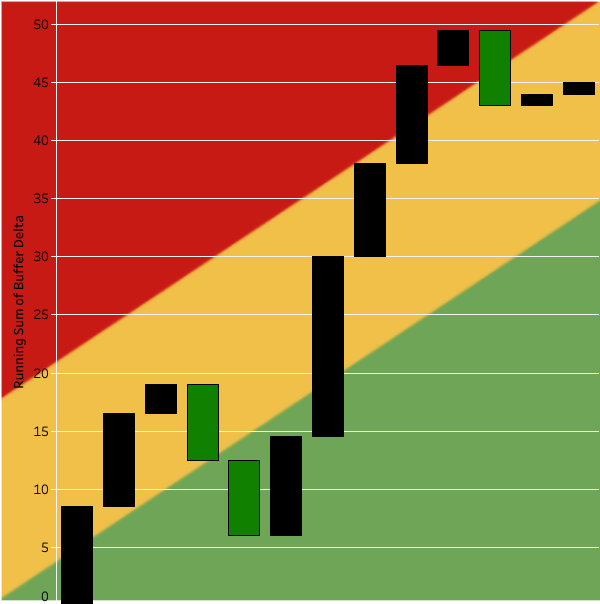
I created a waterfall chart to help visualize the surplus and deficit of buffer. A waterfall chart is a form of data visualization that helps in understanding the cumulative effect of sequentially introduced positive or negative values. Black vertical bars shows a buffer deficit. Green vertical bars illustrate a surplus.
Above is a chart with 13 sequentially completed activities. The original estimate to complete all 13 activities was 35 days but you can see there was a total buffer of ~17 days. As each task was completed, you can see the difference of time remaining. If buffer was consumed, you’ll see black bars and the placement of the bars would be toward the red area of the chart.
The Difference From a Standard Burn Up (Run) Chart
If a team or person is following a delivery framework like Scrum, you’d just see a line trending. Similarly, if you are trending toward the top of the chart early, you may have to consider descoping some commitments, relative to time remaining in a timebox.
What I Like About This Chart
Unlike the burn up chart, the extra dimension of time variance is taken into consideration. An in-progress burn up chart can be a leading indicator, if you’ll complete all of the activities or not in the allotted time.
What I Don’t Like About This Chart
An unnecessary amount of effort is committed to trying to get an estimate right, versus just getting work done. When using Kanban to help manage your work, you just pull the next highest priority work into your queue and get to work. In Scrum, you do the same, until you run out of time in the Sprint.
I’d rather have the right kind of conversations with the team about what commitments we made and if tradeoffs need to be considered. Using an estimate is only helpful to a point.