
As an executive, you will be faced with the choice to do the pivot (if you can) or persevere (if you have no other choice). This will lead to a series of “bets”. You lead with a hypothesis that the things you change will allow you to operate at pre-event levels. But, how long will it actually take for you to validate your hypothesis and have a bet pay off with pre-event levels? If you run out of time to figure it out or run out of bets you can place, then you either lose your standing in the market or worse risk going out of business.
Lean Portfolio Management and Metrics
I recently had the pleasure of doing a webinar with Rune Christensen from Scaled Agile, on the topic of Lean Portfolio Management and Metrics. Lean Portfolio Management is rapidly becoming one of those terms people want to talk about, up there with Value Stream Management. In my world, everyone seems to want to talk about metrics.
How a Backlog of Work is Like a Tank of Gas
Work is decomposed into smaller units (stories) and retained, to create a sufficient level of healthy backlog for a team to deliver. Poor/low backlog may result in a team being blocked by unidentified dependencies, stopping work to refine more backlog mid-sprint, or pulling in work that is not ready, just to keep moving forward.
Knowing your metrics
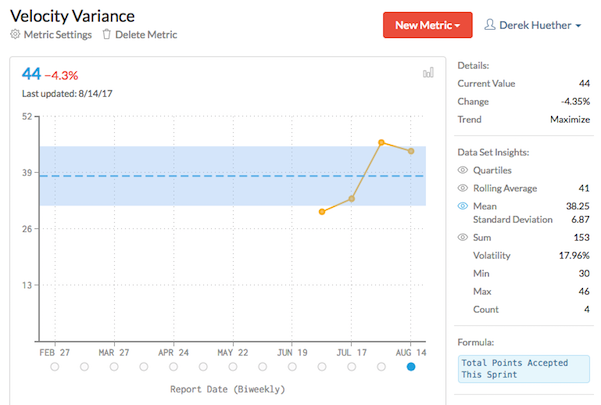
velocity variance
Know your metrics and the behaviors they drive
Everyone at your company should understand which metrics drive the business, and what behaviors they encourage. That's what Joe Nigro, CEO of energy company Constellation, said in a 2016 Harvard Business Review article. He went on to say, “Everyone needs to know how each metric fits into the big picture…why and how we’re measuring something, and how it’s relevant to performance.”
More directly, I would say metrics should capture the changing environment of your business so you can make informed decisions. But how do you know your metrics are any good?
Encouraging behaviors
If you ask your fellow employees which metrics drive the business, would they know? Would they care? I believe their jobs should depend on them caring, though measuring that would be difficult. If they are unwilling to do their part, perhaps they should "help" some other company. Everyone should be held personally accountable to understand what helps drive the business and how they can help. If they knew what the metrics are, how could it change their behavior (in a positive way)?
Metrics executives may be thinking about
From an executive level, I can only imagine every CEO (from Joe Nigro of Constellation to your own) start by thinking about these metrics:
Topline revenue - Money made from selling goods or services
Customer retention - Attracting the right customer, getting them to buy, buy again, buy in higher quantities or at higher rates.
Customer acquisition cost - The total cost associated with acquiring a new customer, including all aspects of marketing and sales.
Gross margin - Calculated as a company's total sales revenue minus its cost of goods sold, divided by the total sales revenue, expressed as a percentage.
Overhead costs - fixed costs that are not dependent on the level of goods or services produced by the business, such as salaries or rents being paid per month.
I hope executive management will help employees understand the metrics that drive the business and why they are important. I hope the employees will internalize these metrics and consider ways to help the company increase revenues, widen margins, or control costs.
One step deeper into the weeds
From a productivity level, be it manufacturing or software development, I think the staff (and the executives) need to understand (and improve) the system of delivery. To this, if executive management doesn't know these productivity numbers, then how can they know when they are making unreasonable requests of the system? A system of delivery in a black box and executives in an ivory tower are not a good combination. A dissatisfied staff can put your company at serious risk, while on the other hand, a satisfied and productive staff can help drive the business.
Cycle time - The total time from the beginning to the end of your process.
Lead time - Starts when a request is made and ends at delivery.
Utilization - 100% being the maximum, it's the act of making practical and effective use of people or things
Throughput - The amount of material or items passing through a system or process. What did you get done or delivered?
Cost of Delay - The means to calculate and compare the cost of not completing something now, by choosing to do it later.
I hope everyone will think of ways to shortening cycle and lead times while maintaining or increasing throughput. If maximum utilization is how you make the greatest topline revenue, how do you reach that utilization level without breaking your people or machinery?
Another step deeper into the weeds
From an individual level, I believe we are truly personally accountable. Let's ask the first two questions from this post again. Which metrics drive the business? What behaviors do they encourage?
Commitment/Completion Ratio - What have I personally committed to? Am I meeting that commitment?
Throughput (Velocity) Variance - Given the things that I've recently completed, am I predictable? Can others make commitments, based on what I do?
Confidence Score - How confident am I that I will actually keep the commitment I made?
I hope individuals will be honest about what they think they can do in a given period of time. I hope they will be honest with their coworkers and with management if they don't think they can keep a commitment.
What behaviors do you think metrics encourage?
Image Source: Calculated Velocity Variance via Notion [UseNotion.com]
Leading and Lagging Indicators
Getting Clarity

I believe the number one reason for failure or waste is a lack of clarity or understanding. If you getting clarity on something, it gives you the freedom to decide if you want to do it or not. If something is ambiguous, you may agree in principle but you don't know what you're really getting yourself into.
OKRs
Firstly, what are your Objectives and Key Results (OKR)? How do you set and communicate goals and results in your organization? Because you want people to move together in the right direction, you need to get clarity.
KPIs
What are your Key Performance Indicators (KPI)? How do you want to measure value that demonstrates how effectively your company is achieving key business objectives? Because you want your organization to evaluate its success at reaching targets, you need to get clarity.
Structure
What does the team design or structure of the organization look like on portfolio, program, product, and service layers? We need a shared understanding of which individuals or teams are responsible for what.
Governance
What does the governance of the organization look like? How do we manage our budget, dependencies, risks, or quality? What are the inputs, outputs, and artifacts?
Metrics and Tools
Because we want to manage our system of delivery, what are necessary metrics and tools of the organization?
Getting Clarity
Remember, if you expect others to commit to something, regardless if it's a process or a deliverable, we need a shared understanding.
Lean Metrics in the Real World
Today, I was faced with the unfortunate task of renewing my driver's license. It's been 10 years since the last renewal and I remember the last time I was at the Maryland MVA (Motor Vehicle Administration) office, I waited for what seemed to be an hour. We all know how painful the experience is. You stand in line, you get to the front of the line, they tell you to go fill out some paperwork and then to get back in line. I will use the opportunity to teach others about lean metrics.
Lead Time
Lead time is the time between the initiation and completion of a production process. In my case, I left the office at 09:00 and arrived back at the office at 10:00. The lead time to get a renewed driver's license was 60 minutes. Given my goal, the shorter the lead time the better.
Cycle Time
Cycle time is the total time from the beginning to the end of a process, as defined by you and your customer. Cycle time includes process time, during which a unit is acted upon to bring it closer to an output, and delay time, during which a unit of work is spent waiting to take the next action. The shorter your cycle times (including delays) the shorter your lead time.
My cycle times included:
- 15 minutes - driving to MVA office
- 5 minutes - standing in initial line to be added to the proper queue
- 16 minutes - wait time to get the front of the line
- 5 minutes - actual renewal processing
- 4 minutes - wait time to be given the new driver's license
- 15 minutes - driving back from the MVA office

My hat comes off to Maryland MVA. On their website, they provide current wait times at the different locations. I took a screen grab before I headed to the local MVA branch. This feedback was very valuable. Given the service I needed, it allowed me to provide an estimate of my time away to others I was going to be working with today.
Throughput
Throughput is the the amount of material or items (people in this case) passing through a system or process per time unit. With an average cycle time of 5 minutes for the renewal process, the throughput in 60 minutes would be 12 people. At first glance, I didn't see any real bottlenecks or delays in their system. Given what I saw, I believe 10 people an hour is a reasonable throughput.
Understanding Lean Metrics
I hope this brief real world example of lean metrics is valuable to you. When I was at a session for value stream mapping at Agile 2015, the poor guy leading the session kept getting lead time and cycle time mixed up. The people in the room heckled the hell out of him. After reading this, that should never happen to you.
Niko-Niko Calendar
niko-niko
While I was at the recent Agile Leadership Network (ALN) event earlier this month, Dave Nicolette presented a talk on metrics. I'll admit, I'm fascinated by metrics. I remember working on the NIH Executive Dashboard and then the NCI Dashboard between 2004 and 2007 . But since then, I've grown to look at metrics differently. Though I've taken steps to ask myself questions to ensure my metrics are worth something, I've seen the Hawthorne Effect in action and it made me question how metrics can be easily manipulated. Don't you hate it when you're trying to measure team performance and then they start acting all crazy due to upcoming dates like the end of the sprint or the end of a deployment cycle? I've seen developers start to rush. Risk goes up and quality can go down, just to try and maintain a velocity. Well, Dave showed a slide in his metrics presentation that really hit home for me. It's called the Niko-Niko (mood) Calendar. Let's say your position in the company is to ensure customer satisfaction. A useful unit of measure would be NPS (Net Promoter Score). Think of it as a customer satisfaction or “happiness” metric. NPS is based on the fundamental perspective that every company’s customers can be divided into three categories: Detractors, Passives, and Promoters. By asking one simple question — How likely are you to recommend [Company X] to a colleague or friend? — you can track these groups and get a clear measure of company performance through its customers’ eyes. I've written about it before in a post titled Outdated Success Criteria.
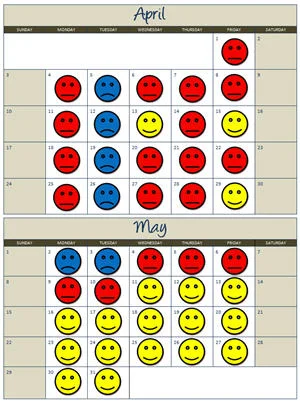
That's all fine and good but what if your position in the company is to ensure employee satisfaction? As a manager or a leader you should be working to keep your employees happy. How would you measure their happiness? You could use a Niko-Niko calendar. Each individual on a team should identify their daily mood in one of three ways: happy, indifferent, or unhappy. Because I keep a daily journal of what I do, I recreated a calendar to see if there were any trends. Do you see any? Can you see the the days I was working at my other job and I was dreading a particular meeting? Can you see the days I spoke to LitheSpeed or when I was hired by LitheSpeed? Though you can't make everyone on your team happy, as a manager or servant-leader, you should be creating an environment that will, in the end, make them happier and more productive. If everyone on the team maintained a mood calendar, a manager or leader could take action before negative feelings become caustic to a team.